

Determination of surface relaxivity for tight sandstone cores based on T2 cut-off value
-
摘要: 确定致密岩心样品表面弛豫率的最常用方法是平均值法和比表面积法,但平均值法结合了压汞测试,会对岩心造成永久伤害。提出了一种基于T2截止值确定致密岩心表面弛豫率的无损新方法。首先,使用该方法确定岩心样品表面弛豫率;之后,将计算结果与平均值法和比表面积法进行对比,并通过选择合适的表面弛豫率将核磁共振T2谱转化为孔隙直径分布;最后,获取样品残余油分布。结果表明,四块岩心样品最终表面弛豫率分别为5.85,2.98,4.66,2.17 μm/s;结合三种方法计算结果可获取中孔和大孔的孔隙直径分布;残余油主要分布在微孔和中孔。该方法是一种无损测试方法,有助于快速有效确定致密岩心表面弛豫率。Abstract: The surface relaxivity for tight cores is commonly determined by the methods of average pore radius (ARS) or surface-to-volume ratio (SVR). The ARS method is time-consuming, and permanent damage to core samples will occur due to the injection of mercury. In this study, a non-destructive method is proposed, instead of the ARS method, to calculate the surface relaxivity of tight core samples based on T2 cut-off value. Firstly, surface relaxivity is calculated using the new method (pseudo T2 cut-off, PTC). Secondly, the calculated surface relaxivity of ARS and SVR methods are compared. Thirdly, the T2 spectrum is converted into pore diameter distribution by choosing appropriate surface relaxivity. Finally, residual oil distribution can be obtained. The ultimate surface relaxivity values for tight sandstone core samples are 5.85, 2.98, 4.66, and 2.17 μm/s. Moreover, we obtained the pore diameter distribution in mesopores and macropores by jointly using these three methods. Residual oil is mainly distributed in micropores and mesopores. The new method proposed in this study is nondestructive and is helpful to quickly and efficiently determine the surface relaxivity of tight cores.
-

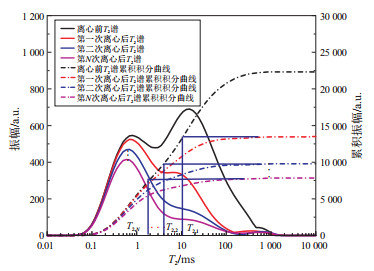
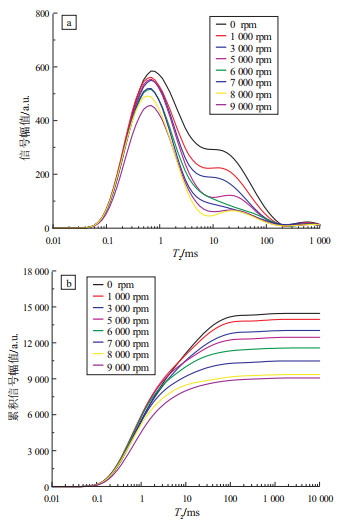
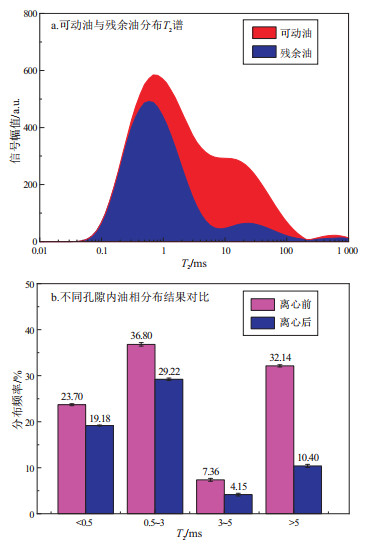
图 4 离心前后T2谱(a)和T2谱累积积分曲线(b)
Figure 4. T2 spectrum (a) and cumulative T2 distribution (b) before and after centrifugation

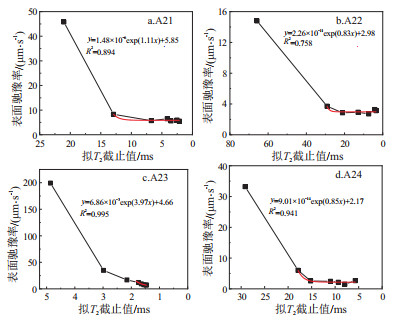
图 5 拟T2截止值与表面弛豫率关系
Figure 5. Correlations between surface relaxivity and pseudo T2 cut-off values

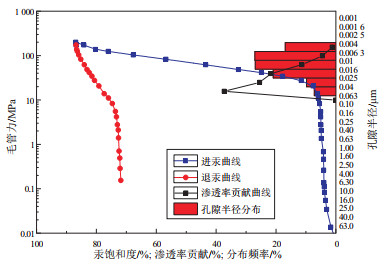
图 6 毛管力、孔隙半径分布以及渗透率贡献
Figure 6. Contributions of capillary pressure, pore radius distribution and permeability

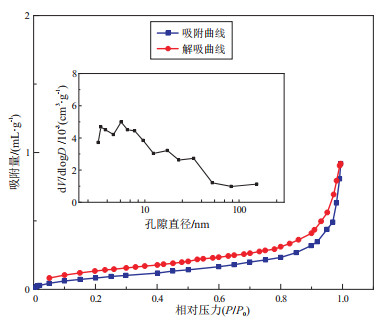
图 7 吸附/解吸等温曲线以及孔隙直径分布
Figure 7. Adsorption/desorption isotherms and pore diameter distribution

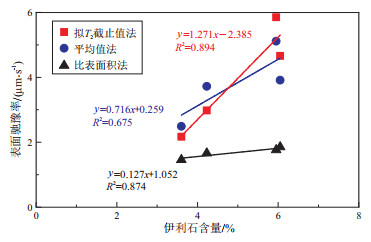
图 8 表面弛豫率计算结果与伊利石含量关系
Figure 8. Calculated surface relaxivity as a function of illite content

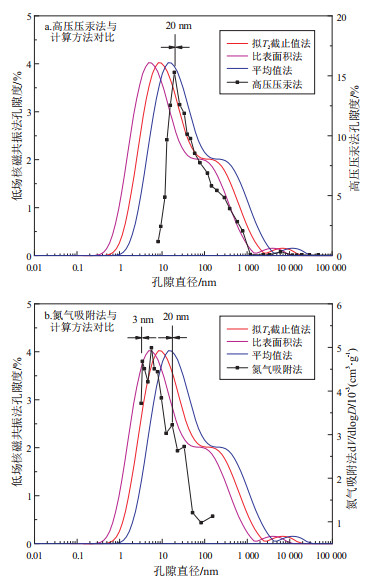
图 9 不同方法的孔隙直径分布换算
Figure 9. Pore diameter distribution calculated with different methods
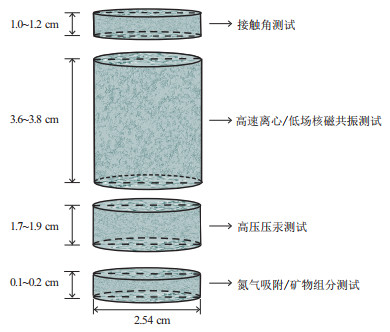
表 1 岩心样品物性参数
Table 1. Petrophysical properties of core samples
测试方法 样品号 直径/cm 长度/cm 渗透率/10-3μm2 孔隙度/% 接触角 A11 2.54 1.12 0.068 12.37 A12 2.54 1.08 0.057 10.69 A13 2.54 1.15 0.023 14.42 A14 2.54 1.18 0.042 9.56 高速离心/低场核磁共振 A21 2.54 3.62 0.068 12.37 A22 2.54 3.66 0.057 10.69 A23 2.54 3.64 0.023 14.42 A24 2.54 3.64 0.042 9.56 高压压汞 A31 2.54 1.76 0.068 12.37 A32 2.54 1.71 0.057 10.69 A33 2.54 1.72 0.023 14.42 A34 2.54 1.72 0.042 9.56 氮气吸附/矿物组分 A41 2.54 0.13 0.068 12.37 A41 2.54 0.14 0.057 10.69 A43 2.54 0.14 0.023 14.42 A44 2.54 0.15 0.042 9.56  下载: 导出CSV
表 2 拟T2截止值法表面弛豫率计算结果
Table 2. Calculation results of surface relaxivity using PTC method
样品号 转速/rpm 毛管力/MPa 拟T2截止值/ms 表面弛豫率/(μm·s-1) A21 1 000 0.027 21.05 45.77 3 000 0.240 12.92 8.29 5 000 0.670 6.73 5.72 6 000 0.960 4.13 6.48 7 000 1.310 3.51 5.59 8 000 1.710 2.53 5.93 9 000 2.160 2.15 5.52 A22 1 000 0.027 65.79 14.79 3 000 0.240 29.15 3.71 5 000 0.670 21.05 2.85 6 000 0.960 12.92 2.92 7 000 1.310 7.32 2.71 8 000 1.710 4.13 3.28 9 000 2.160 3.51 3.12 A23 1 000 0.027 4.86 199.23 3 000 0.240 2.98 34.72 5 000 0.670 2.15 16.85 6 000 0.960 1.75 11.98 7 000 1.310 1.65 9.46 8 000 1.710 1.56 7.62 9 000 2.160 1.48 7.21 A24 1 000 0.027 29.15 33.21 3 000 0.240 17.89 6.01 5 000 0.670 15.20 2.55 6 000 0.960 1 097.00 2.45 7 000 1.310 9.33 2.12 8 000 1.710 7.92 1.51 9 000 2.160 5.72 2.64
下载: 导出CSV
表 3 平均值法表面弛豫率计算结果
Table 3. Calculation results of surface relaxivity using ARS method
样品号 T2LM/ms Rp/μm ρ/(μm·s-1) A31 2.29 23.4 5.11 A32 2.53 18.8 3.72 A33 1.84 14.4 3.91 A34 2.60 22.9 2.49
下载: 导出CSV
表 4 比表面积法表面弛豫率计算结果
Table 4. Calculation results of surface relaxivity using SVR method
样品号 S/(m2·g-1) V/10-3(cm3·g-1) ρ/(μm·s-1) A41 1.11 4.47 1.76 A42 1.86 7.80 1.66 A43 2.60 10.40 1.54 A44 1.04 6.08 3.18
下载: 导出CSV
表 5 岩心样品黏土矿物含量
Table 5. Clay mineral contents in core samples
样品号 伊利石/% 绿泥石/% 伊蒙混层/% A21 4.23 6.88 5.95 A22 5.95 5.42 4.23 A23 6.05 7.30 6.05 A24 3.60 5.54 3.60
下载: 导出CSV
-
[1] 邹才能, 朱如凯, 白斌, 等. 致密油与页岩油内涵、特征、潜力及挑战[J]. 矿物岩石地球化学通报, 2015, 34(1): 3-17. https://www.cnki.com.cn/Article/CJFDTOTAL-KYDH201501002.htmZOU Caineng, ZHU Rukai, BAI Bin, et al. Significance, geologic characteristics, resource potential and future challenges of tight oil and shale oil[J]. Bulletin of Mineralogy, Petrology and Geochemistry, 2015, 34(1): 3-17. https://www.cnki.com.cn/Article/CJFDTOTAL-KYDH201501002.htm [2] FOLEY I, FAROOQUI S A, KLEINBERG R L. Effect of paramagnetic ions on NMR relaxation of fluids at solid surfaces[J]. Journal of Magnetic Resonance, Series A, 1996, 123(1): 95-104. doi: 10.1006/jmra.1996.0218 [3] KENYON W E. Petrophysical principles of applications of NMR logging[J]. The Log Analyst, 1997, 38(2): 21-40. [4] KLEINBERG R L, KENYON W E, MITRA P P, et al. Mechanism of NMR relaxation of fluids in rock[J]. Journal of Magnetic Resonance, Series A, 1994, 108(2): 206-214. doi: 10.1006/jmra.1994.1112 [5] XIAO Liang, MAO Zhiqiang, ZOU Changchun, et al. A new methodo-logy of constructing pseudo capillary pressure (Pc) curves from nuclear magnetic resonance (NMR) logs[J]. Journal of Petroleum Science and Engineering, 2016, 147: 154-167. doi: 10.1016/j.petrol.2016.05.015 [6] SULUCARNAIN I, SONDERGELD C H, RAI C S. An NMR study of shale wettability and effective surface relaxivity[C]//Proceedings of the SPE Canadian Unconventional Resources Conference. Calgary, Alberta, Canada: Society of Petroleum Engineers, 2012. [7] WASHBURN K E, SANDOR M, CHENG Yuesheng. Evaluation of sandstone surface relaxivity using laser-induced breakdown spectroscopy[J]. Journal of Magnetic Resonance, 2017, 275: 80-89. doi: 10.1016/j.jmr.2016.12.004 [8] CLARKSON C R, SOLANO N, BUSTIN R M, et al. Pore structure characterization of North American shale gas reservoirs using USANS/SANS, gas adsorption, and mercury intrusion[J]. Fuel, 2013, 103: 606-616. doi: 10.1016/j.fuel.2012.06.119 [9] HOSSAIN Z, GRATTONI C A, SOLYMAR M, et al. Petrophysical properties of greensand as predicted from NMR measurements[J]. Petroleum Geoscience, 2011, 17(2): 111-125. doi: 10.1144/1354-079309-038 [10] LIVO K, SAIDIAN M, PRASAD M. Effect of paramagnetic mineral content and distribution on nuclear magnetic resonance surface relaxivity in organic-rich Niobrara and Haynesville shales[J]. Fuel, 2020, 269: 117417. doi: 10.1016/j.fuel.2020.117417 [11] DALAS F, KORB J P, POURCHET S, et al. Surface relaxivity of cement hydrates[J]. The Journal of Physical Chemistry C, 2014, 118(16): 8387-8396. doi: 10.1021/jp500055p [12] BENAVIDES F, LEIDERMAN R, SOUZA A, et al. Estimating the surface relaxivity as a function of pore size from NMR T2 distributions and micro-tomographic images[J]. Computers & Geosciences, 2017, 106: 200-208. [13] SAIDIAN M, PRASAD M. Effect of mineralogy on nuclear magnetic resonance surface relaxivity: a case study of Middle Bakken and Three Forks formations[J]. Fuel, 2015, 161: 197-206. doi: 10.1016/j.fuel.2015.08.014 [14] ZHENG Sijian, YAO Yanbin, LIU Dameng, et al. Characterizations of full-scale pore size distribution, porosity and permeability of coals: a novel methodology by nuclear magnetic resonance and fractal analysis theory[J]. International Journal of Coal Geology, 2018, 196: 148-158. doi: 10.1016/j.coal.2018.07.008 [15] ZHAO Peiqiang, WANG Liang, XU Chenhao, et al. Nuclear magnetic resonance surface relaxivity and its advanced application in calcula-ting pore size distributions[J]. Marine and Petroleum Geology, 2020, 111: 66-74. doi: 10.1016/j.marpetgeo.2019.08.002 [16] WESTPHAL H, SURHOLT I, KIESL C, et al. NMR Measurements in carbonate rocks: problems and an approach to a solution[J]. Pure and Applied Geophysics, 2005, 162(3): 549-570. doi: 10.1007/s00024-004-2621-3 [17] TESTAMANTI M N, REZAEE R. Determination of NMR T2 cut-off for clay bound water in shales: a case study of Carynginia Formation, Perth Basin, western Australia[J]. Journal of Petroleum Science and Engineering, 2017, 149: 497-503. doi: 10.1016/j.petrol.2016.10.066 [18] ZHENG Sijian, YAO Yanbin, LIU Dameng, et al. Nuclear magnetic resonance surface relaxivity of coals[J]. International Journal of Coal Geology, 2019, 205: 1-13. doi: 10.1016/j.coal.2019.02.010 [19] 张亚东, 高光辉, 刘正鹏, 等. 致密砂岩储层流体差异性赋存特征: 以鄂尔多斯盆地三叠系延长组为例[J]. 石油实验地质, 2021, 43(6): 1024-1030. doi: 10.11781/sysydz2021061024ZHANG Yadong, GAO Guanghui, LIU Zhengpeng, et al. Differential characteristics of fluid occurrence in tight sandstone reservoirs: a case study of Triassic Yanchang Formation in Ordos Basin[J]. Petroleum Geology and Experiment, 2021, 43(6): 1024-1030. doi: 10.11781/sysydz2021061024 [20] 王伟, 陈朝兵, 许爽, 等. 鄂尔多斯盆地延长组致密砂岩不同尺度孔喉分形特征及其控制因素[J]. 石油实验地质, 2022, 44(1): 33-40. doi: 10.11781/sysydz202201033WANG Wei, CHEN Zhaobing, XU Shuang, et al. Fractal characteristics and its controlling factors of pore-throat with different scales in tight sandstones of the Yanchang Formation in the Ordos Basin[J]. Petroleum Geology & Experiment, 2022, 44(1): 33-40. doi: 10.11781/sysydz202201033 [21] SING K S. Reporting physisorption data for gas/solid systems with special reference to the determination of surface area and porosity (Recommendations 1984)[J]. Pure and Applied Chemistry, 1985, 57(4): 603-619. doi: 10.1351/pac198557040603 [22] AYAPPA K G, DAVIS H T, DAVIS E A, et al. Capillary pressure: centrifuge method revisited[J]. AIChE Journal, 1989, 35(3): 365-372. doi: 10.1002/aic.690350304 -

 点击查看大图
计量
- 文章访问数: 614
- HTML全文浏览量: 87
- PDF下载量: 54
- 被引次数: 0
 苏公网安备32021102000780号